Measuring Net-Zero Performance and Success
As we discussed in the previous post in our Net Zero series, pursuing a net-zero standard is an investment. So, how do you know if that investment is paying off? Here, we look at methods and tools for measuring net-zero performance and success.
Consumption vs Generation
First and foremost, tallying up the monthly energy bills at the end of the year provides a clear picture of a home’s net-zero performance. The total cost should, obviously, be close to zero. In the case of NetZeroRowhouse, we consumed a total of 10.6 kWh in 2022, and we are on track to match that in 2023. During the summer months, we fed more energy back into the grid, whereas during the winter, we drew from our local utility provider.
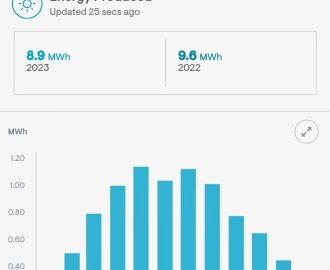
Speaking of solar, we generated 9.4 kWh from the rooftop array in 2022, indicating that we only drew approximately 1.2 kWh from our electrical grid. From an energy perspective, we were close but not quite at net zero. Most photovoltaic systems feature a web-enabled interface, offering a remarkable level of detail and scale. From an energy perspective, we were close but not quite at net zero. The actual production of the array, as calculated from City Renewables, predicted 10 kWh. Given the variability of weather, our generation was just 96% of what was anticipated, so very close to the predicted total.
Where did the energy go?
Since all of our energy usage is electric, we can track consumption to measure net-zero performance. To provide additional detail, we utilize the Leviton Smart Panel, and can delve deeply into understanding where that electricity is being used. For instance, the three-zone Mitsubishi Ducted Heat Pump consumed about 277 kWh in January 2023. Our next significant load is hot water generation. In some months, we use more energy to both generate electricity and keep the mechanical room warm enough. For example, in March 2023, we spent 234 kWh on the heat pump water heater and 351 kWh on the space heater, totaling 585 kWh—more than twice what we spent on heating (216 kWh). This energy vampire is, in fact, a design issue for the water heater installation. Moving into 2024, we have started venting the heat pump water heater directly to the exterior to reduce the heating load in the mechanical closet. Examining energy usage associated with food storage and preparation is also key. In a typical month, the Bosch induction cooktop usage ranges from 9 to 15 kWh, the oven between 37 kWh and 64 kWh, and refrigeration is another 43 kWh to 56 kWh. In retrospect, having the refrigerator, beverage refrigerator, and coffee machine all on one circuit provides insight on life’s essentials!
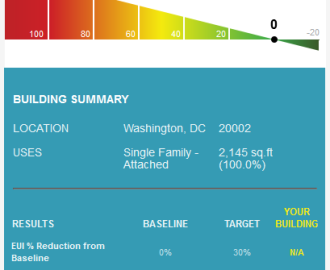
We support this claim by examining a couple of metrics. The Home Energy Rating System (HERS) is the industry standard for measuring energy efficiency. A home receives a relative performance score compared to a reference house. The lower the number, the more energy-efficient the home. The projected HERS score for the project is -5; this will be confirmed in 2024. Another helpful metric is the Energy Use Intensity (EUI), which is the industry’s equivalent to a miles-per-gallon rating. It is calculated by dividing the total energy a home (or any building) consumes in one year by its square footage. A low EUI value signifies good energy performance. Using ZeroTool, we can see that the target EUI for a similar-sized rowhouse in Washington, DC, is about 30. To meet a net-zero standard, that number should be below 10. The EUI for 2022 came in at 1.9 last year! By all accounts, the home is a net-zero success. In the first year, the solar array offset an impressive 88.6 percent of the energy consumed.
Value of Solar Renewable Energy Tax Credits
There are other ways to offset those initial costs. Maryland, Virginia, and Washington, DC, all offer solar energy incentives. Homes outfitted with panels can generate Solar Renewable Energy Credits (SRECs), which have a monetary value and can be sold or traded to generate revenue for the owner. The Capitol Hill rowhouse generates about 8 to 10 SRECs per year, each valued between $300 to $400. In 2022, the family received $2,877 in revenue from the energy credits and only spent $702 on electricity, netting over $2,100. From a cost perspective, we are actually Net Positive!
Net Zero is the Way Forward
Sustainably built homes can play an integral part in the climate change solution. Net zero is the way of the future, but it’s never too early to start—or too late to change. The available technology and options have reached the point where net zero is an attainable goal, and one we hope more clients will pursue with the help of Teass Warren Architects. While, measuring net-zero performance and success is critical, we also want to create thoughtful and well-designed homes that are a joy to live in!

